As we approach the final stretch of the 2024 presidential election, many Americans (including us here at Blue Sedition) are turning to polls to gauge the state of the race. With Vice President Kamala Harris is vacillating in national polling averages – going from as much as +2 and as low as -1 – it's only natural to wonder how much stock we should put in these numbers2. After all, recent election cycles have left many skeptical about polling accuracy.
The 2016 and 2020 elections saw significant polling errors that caught many by surprise. In 2016, state-level polls underestimated Donald Trump's support, particularly in key Midwest states. While 2020 national polls were more accurate, state-level polling again missed the mark in several battleground states2. These misses have led to ongoing debates about polling methodology and reliability.
One key factor to consider is how polling has evolved since 2016. Pollsters have made concerted efforts to refine their techniques, employing a wider array of methods to reach voters and accounting for potential biases in their samples2. For instance, many pollsters now put more emphasis on education levels when weighting their samples, as education emerged as a key predictor of voting behavior in recent elections.
RCP recently introduced an "adjusted" polling average that attempts to account for past polling errors. However, analysis suggests this approach may actually introduce more error than it corrects. Historical data indicates that polling bias in one election cycle has not been predictive of bias in subsequent cycles1. This underscores the importance of treating poll adjustments and forecasts with skepticism.
As we interpret polls in the final weeks of the campaign, experts recommend several key considerations. First, pay attention to sample sizes and methodologies. Polls with larger samples (ideally around 1,000 respondents for national polls) and those focusing on likely voters tend to be more reliable2. It's also important to consider how polls were conducted – whether by phone, online, or a combination of methods.
It's worth noting that the polling landscape has changed significantly over the past two decades. A comprehensive study by Pew Research Center examined national public opinion polling from 2000 to 2022, tracking changes in sample sources and interview modes3. This research highlights the industry's shift from traditional telephone polling to more diverse methodologies, including online and mixed-mode approaches.
Ultimately, the only poll that truly matters is the one that takes place on Election Day... buuuuuut... we can't help but look at the numbers in the meantime.
When we here at Blue Sedition look at the polls, we only see two possible paths to victory given the way the electoral map is shaping up: 1. Harris wins the Rust Belt states of Michigan, Wisconsin, and Pennsylvania, along the expected states like Minnesota, Illinois, and Virginia = 270 2. Harris wins Michigan and Wisconsin, but loses Pennsylvania, and picks up Arizona or Nevada, and Georgia or North Carolina = 270+

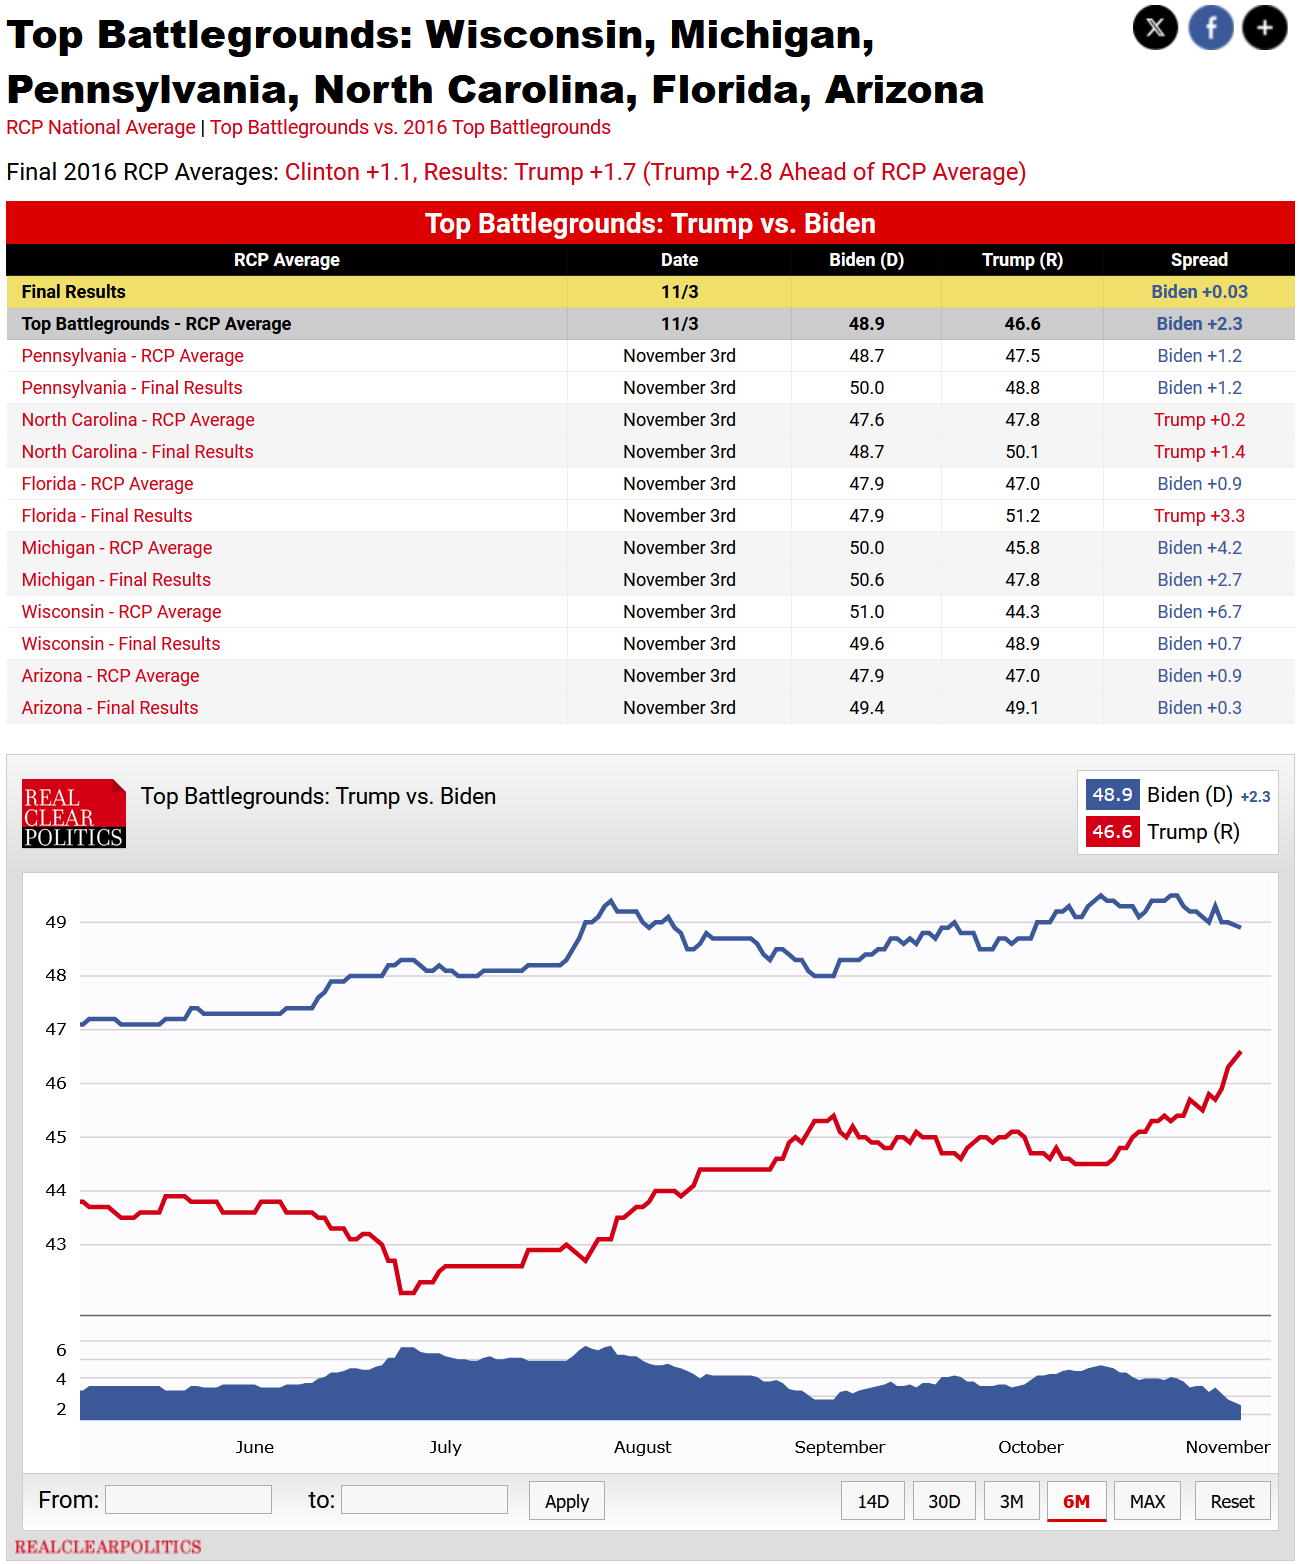
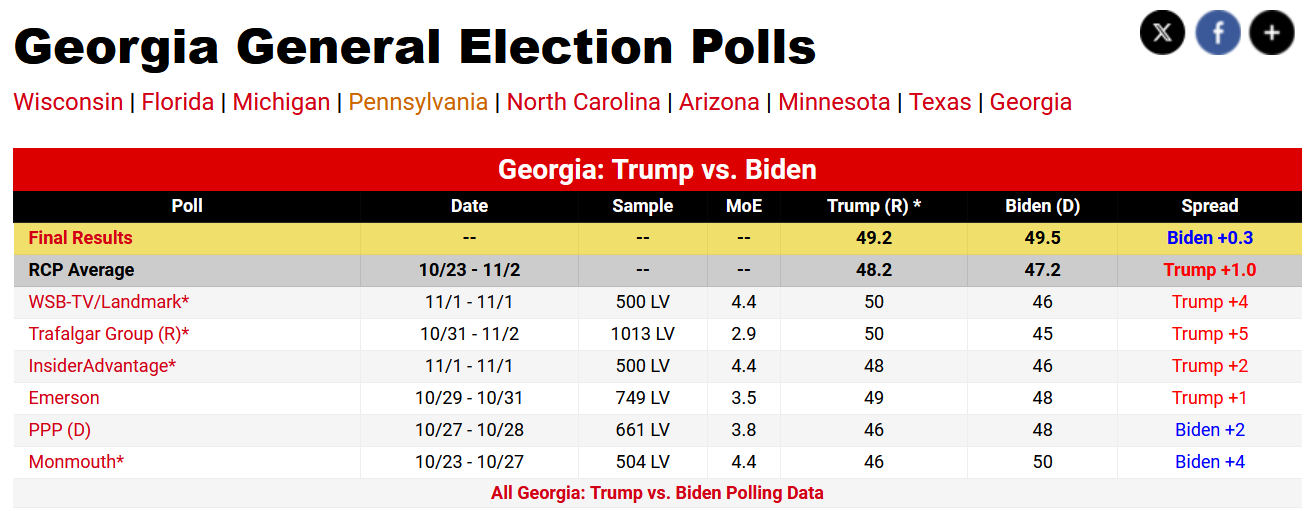
The most important thing to note about this final bit of polling from RCP in 2020 (Biden vs. Trump) is that the polls had Biden holding decent leads in each battleground state the day of the election. However, Biden's road to victory was Pennsylvania, Michigan, Wisconsin, and Georgia. While the polling indicated fairly safe results for Michigan and Wisconsin, each was much closer than those polls indicated. Michigan had Biden with a comfortable +4.2 average the day of the election, but when the votes were counted the actual result was actually +2.7 – a miss of 1.5 points. Wisconsin was even wilder. Biden was +6.7 in the polling average, but the actual result was +0.7 – a SIX point miss. Pennsylvania was the closest of the four, with Biden +1.2 in the polling average and +1.2 in the actual result – a pleasant return that RCP pollsters should be happy with. Georgia, as well all remember, ended up being the key to the election. Biden was -1.0 in the polling average and +0.3 in the actual result – a miss of 1 point AND in the other direction.

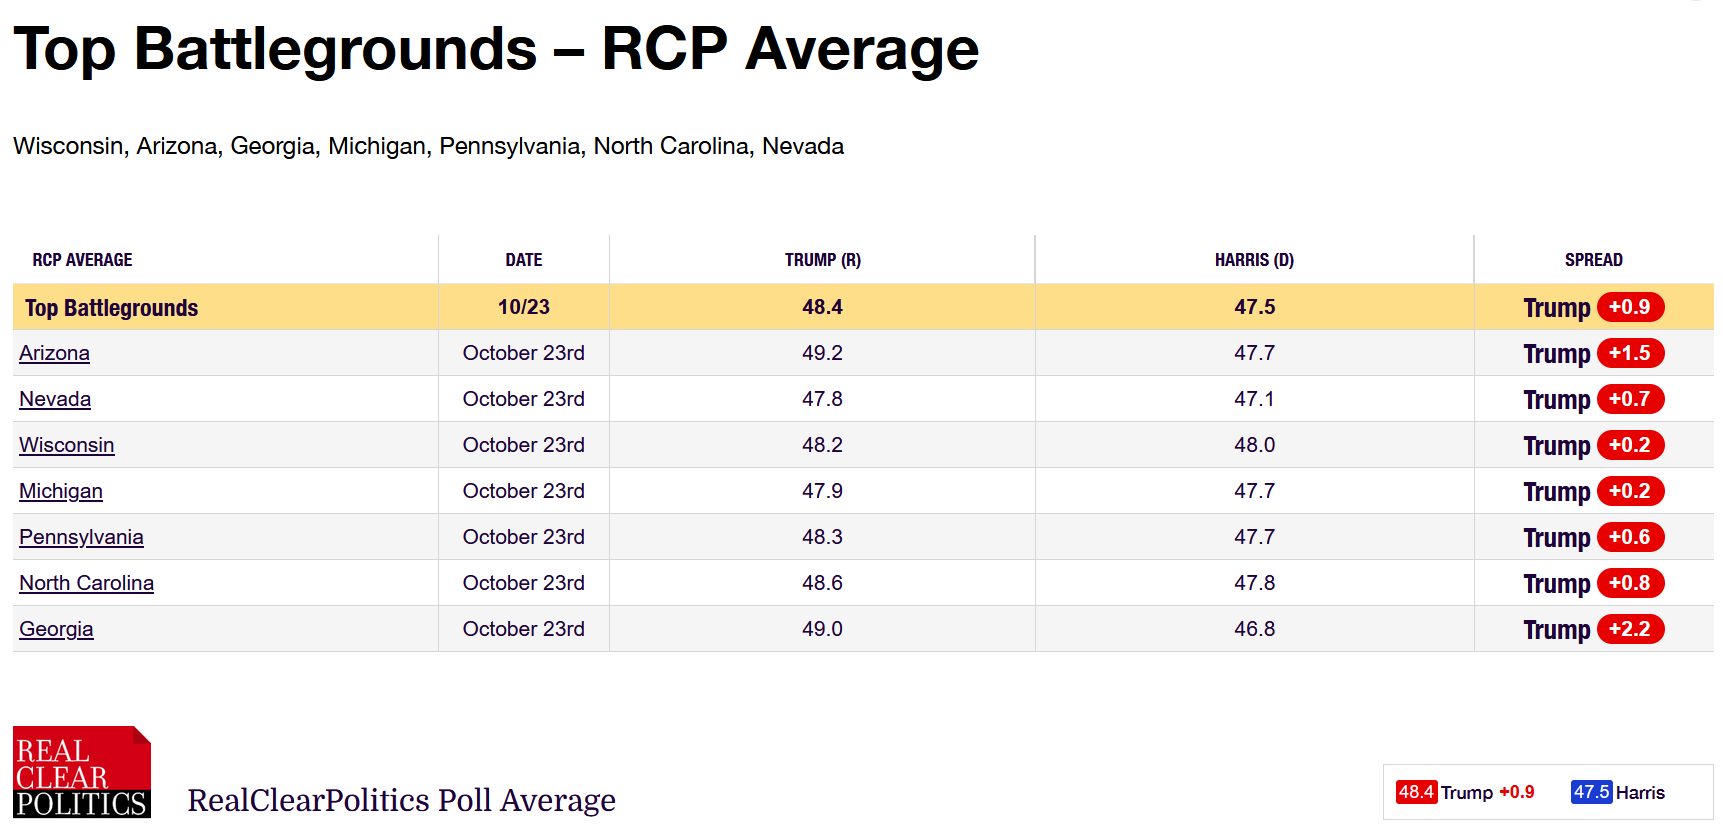
Looking ahead to 2024, we see a similar pattern emerging, but the polling methodologies have been adjusted to account for the 2016 and 2020 misses. We looked at the RCP Pollster Scorecard which includes a mix of pollsters, some of which have shown a tendency to favor Republicans4. For example, Trafalgar Group, known for its Republican lean, is frequently included in RCP's averages more now than in the past. This inclusion can affect the overall average if such pollsters consistently show better numbers for Republican candidates compared to others. Lo and behold, the 2024 polling averages as of October 24, 2024:

Now, before you jump out the window because the entire column is red, remember that these are averages and that the critical swings states are around a half-point-or-less difference. Wisconsin, for example, is a -0.2 for Harris, but that is well within the margin of error. The same can be said for Michigan, where Harris is also -0.2. Pennsylvania is wider, at -0.6, but there are some key differences in voter turnout this time around.
For instance, despite what Trump loyalists insist at every opportunity, our lives were much worse in 2020 – there was a global pandemic. The pandemic was a significant factor in the 2020 election, causing people in areas where early voting was not as prevalent to vote on Election Day. Coupled with the Right's staunch stance that in-person voting is the only way to ensure election integrity, the 2020 election saw a significant number of Trump voters casting their ballots on Election Day. In 2024, due in part to Trump and his supporters' FALSE insistence that the 2020 election was stolen, the Right has been more likely to vote early. We believe that this bloc will likely be comprised of the overall voter base, not necessarily new voters – making the early voting numbers leaning more toward the Right, but could cause the day-of voting to lean more toward the Left than in recent elections.
Additional Reading:
- How to Read the Polls
- The Current State of U.S. Political Polling
- Top Battlegrounds (2020)
- Top Battleground (2024)
Citations:
